Today we are talking about Chapter 9 of the book "Regional Landscapes of the United States and Canada" by Stephen Birdsall.
Chapter 9 is called the Changing South. Included in this region is Virginia, North Carolina, South Carolina, Georgia, Florida, Alabama, Kentucky, Tennessee, Mississippi, Louisiana, Texas, Arkansas, Illinois and Missouri.
The book talks about "Pittsburgh Plus." Pittsburgh's United States Steel Company inflicted a new Pricing Policy. Birdsall writes, "Under this company policy, consumers of Alabama Steel paid the price of steel at Pittsburgh plus $3.00 per ton ($2.72 per metric ton) plus regular freight costs from Birmingham." This way it was cheaper for Atlanta firms to order steel from Pittsburgh. (p. 175)
Basically, the US Steel company made this "discriminatory policy" against TCI's Steelworks in Alabama after famous banker J.P. Morgan, who owned the US Steel Company, took control of TCI in 1907. The US Steel officials did not want to compete with TCI so they made it impossible for TCI to compete with them.
Wednesday, October 10, 2012
Chapter 8
Today we are talking about Chapter 8 of the book "Regional Landscapes of the United States and Canada" by Stephen Birdsall. Chapter 8 talks about the Appalachia and the Ozarks. Included in this region are parts of Oklahoma, Missouri, Arkansas, New York, Pennsylvania (not Pittsburgh), West Virginia, Ohio, Kentucky, Tennessee, Alabama, Georgia, South Carolina, North Carolina, Virginia and Maryland. A lot states are included, but not all of the land in each states applies to this region.
Birdsall writes, "Appalachia's population is conservative, both politically and religiously." (p. 152)
In the 2004 election, John Kerry won Pittsburgh and the Pittsburgh suburbs, by 15 points. The last time a Republican Presidential Candidate won Pennsylvania was in 1988, but George H. W. Bush did not have a good performance in Pittsburgh.
Chapter 7
Today we are talking about Chapter 7 of the book "Regional Landscapes of the United States and Canada" by Stephen Birdsall. (Note: We skipped Chapter 6 because it was about Canada and this is a US Geography course.)
Chapter 7 is about the Bypass East. The Bypass East includes some of Canada as well as the US. Included in this chapter is New York, Vermont, New Hampshire, Maine and some of Canada such as Nova Scotia and Prince Edward Island.
Birdsall writes on p. 133, "The Bypassed East is no place for people who want a dry, warm climate. It is a place where polar, continental and maritime weather systems meet."
So, let's talk a little about Pittsburgh's climate:
Pittsburgh's climate gets a little hot in July (average high 82.7 degrees F), but in the winter it gets cold. In January, the average high is 35.1 degrees F.
"Almost all of the region [Birdsall is taking about the Bypass East] receives substantial and evenly distributed precipitation, usually between 100 and 150 centimeters (40 to 60 inches) annually and spread throughout the year," Birdsall adds. (p. 133)
Pittsburgh has rain throughout the year. From data from 1971-2000, the month with the least rain is October (2.25 inches) and the month with the most is June (4.12). The average number of inches a year is 37.85. So the Bypass East could theoretically get more inches than Pittsburgh.
Monday, October 8, 2012
Chapter 5
Today we are talking about Chapter 5 of the book "Regional Landscapes of the United States and Canada" by Stephen Birdsall.
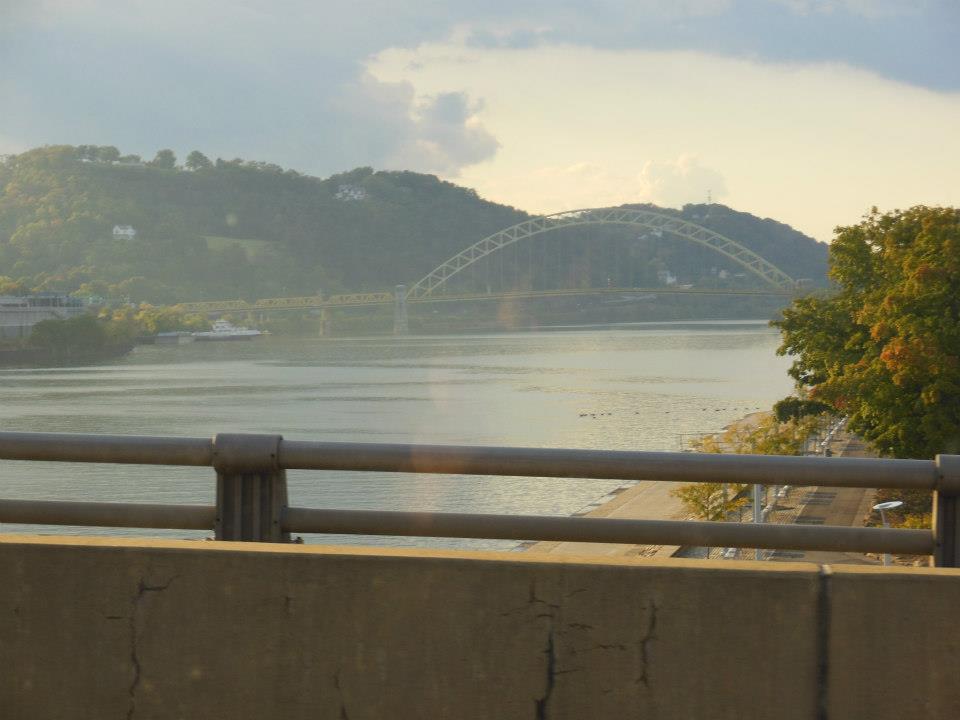
First, to brighten your day up, I've posted a picture of our favorite place, Pittsburgh. This photo belongs to my friend and is used with permission.
 Ah, such a nice day in Pittsburgh. Soon it will get cold and snowy.
Chapter 5, called the North American Manufacturing Core talks about Pittsburgh. How exciting! The North American Manufacturing Core includes some parts of the following states: Wisconsin, Illinois, Indiana, Michigan, Indiana, Ohio, Pennsylvania, Maryland, Delaware, New Jersey, Connecticut, Rhode Island, Massachusetts, New York, Vermont and New Hampshire.
But who cares about all of those other states. Let's just focus on Pennsylvania's Pittsburgh.
The book states, "At the end of 2006, Pittsburgh's unemployment was 4.9 percent compared to 7.2 percent for the Detroit metro area." (p. 105)
But, unfortunately, the recession hit in 2008 and now unemployment nationwide is 7.8. (Bureau of Labor and Statistics). However, it is a little lower in Pittsburgh. The rate is 7.5 percent.
The unfortunate news is the rate is 2.9% higher than it was 6 years ago.
First, to brighten your day up, I've posted a picture of our favorite place, Pittsburgh. This photo belongs to my friend and is used with permission.
Chapter 5, called the North American Manufacturing Core talks about Pittsburgh. How exciting! The North American Manufacturing Core includes some parts of the following states: Wisconsin, Illinois, Indiana, Michigan, Indiana, Ohio, Pennsylvania, Maryland, Delaware, New Jersey, Connecticut, Rhode Island, Massachusetts, New York, Vermont and New Hampshire.
But who cares about all of those other states. Let's just focus on Pennsylvania's Pittsburgh.
The book states, "At the end of 2006, Pittsburgh's unemployment was 4.9 percent compared to 7.2 percent for the Detroit metro area." (p. 105)
But, unfortunately, the recession hit in 2008 and now unemployment nationwide is 7.8. (Bureau of Labor and Statistics). However, it is a little lower in Pittsburgh. The rate is 7.5 percent.
The unfortunate news is the rate is 2.9% higher than it was 6 years ago.
Chapter 4
Today we are talking about Chapter 4 of the book "Regional Landscapes of the United States and Canada" by Stephen Birdsall.
Chapter 4 talks about Northeastern United States. In the book, they call it the Megalopolis. Included are parts of New Hampshire, Rhode Island, Connecticut, parts of New York, New Jersey, Delaware, Maryland, Washington D.C., some of Virginia and finally, some of Pennsylvania. But although we do talk about Pennsylvania in this chapter, it does not include Pittsburgh. Pittsburgh is in Western PN and we are talking about eastern PN, which includes the state's capital, Harrisburg and the historical city of Philadelphia.
The book states, "Ten of the country's 46 Metropolitan areas exceeding 1 million people in 2000 were located in the Megalopolis." (p. 66)
The US Census Bureau has a link to the Annual Estimates of the Population of Metropolitan areas from April 1, 2010 to July 1, 2011. If you click a link, go to "Annual Estimates of the Population of Metropolitan and Micropolitan Statistical Areas: April 1, 2010 to July 1, 2011" and click XLS to access the information I'm about to tell you. But if you click XLS, the information will load in Excel.
In the Excel document, the population estimates for 2011 are 2,359,746 people.
But I know what you're thinking, Maddy, the book was talking about the year 2000. Why are you giving me information for 2011. Well, I think it's important to have up to date information. Isn't that the point of a blog?
Let's back-up and look at data from 12 years ago, just like data our textbook cited. (Remember the book came out in 2009 -- before the 2010-11 census data came out.) For this, we are going to this link (also on the US Census site.) From there, click Table three (Metropolitan Areas Ranked by Population: 2000)'s excel document. The nice thing about this document is it has the most populated areas in order. Pittsburgh is 22nd biggest metropolitan place in the US (2,358,695 people). Some of the cities in the Megalopolis that beat Pittsburgh were NYC (1st) and Philadelphia (6th). Pittsburgh did beat Hartford, CT (came in at 42).
Not that much of a difference in 11 years, is it?
What's the point of this post? How do Pittsburgh relate to the Megalopolis? Well, we are comparing Pittsburgh's Metropolitan area to the Megalopolis. As you can see, Pittsburgh's metropolitan area is similar to Megalopolis' area
Subscribe to:
Comments (Atom)